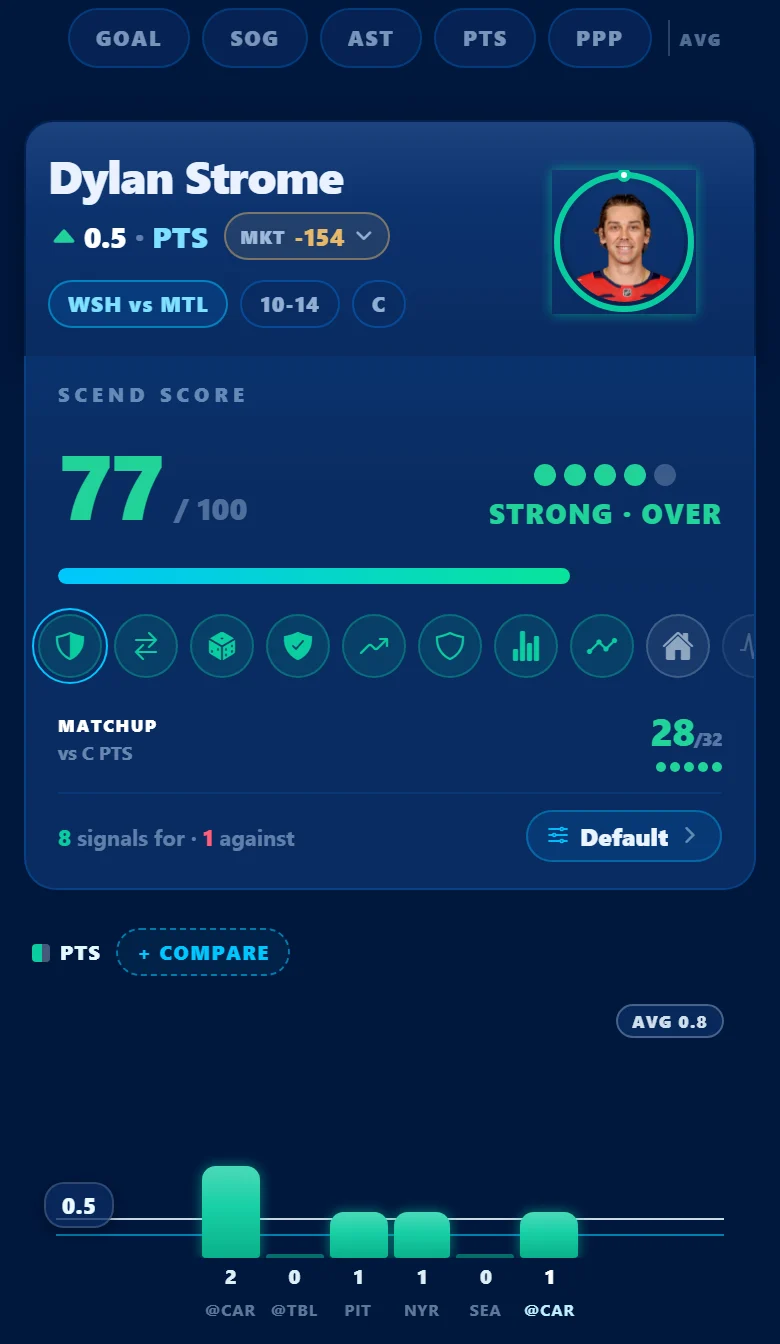
Now in private beta · NFL · NBA · MLB · NHL · CFB

Build your own prop model.

ASCEND is a player-prop research engine for five leagues. Build a transparent scoring model that ranks every edge your way — then track your picks and see which models actually win. Research free, no account needed.

Free to research during beta · early-access perks for everyone who joins now.

🔒 No spam· 🆓 Research free· 21+· Onboarding sharp bettors in waves
5 Leagues — NFL · NBA · MLB · NHL · CFB
15+ Weighted signals
0 Black boxes
My Model · Top Plays
Today
NFLNBAMLBNHLCFB
Over 1.5 TBMLB · vs NYM
Park + weather · L10 75% · H2H 5/8
91
Your model
Strong lean
Under 61.5 Rec YdsNFL · vs MIN
Field zone edge · team D 1st · L10 83%
97
Your model
Max conviction
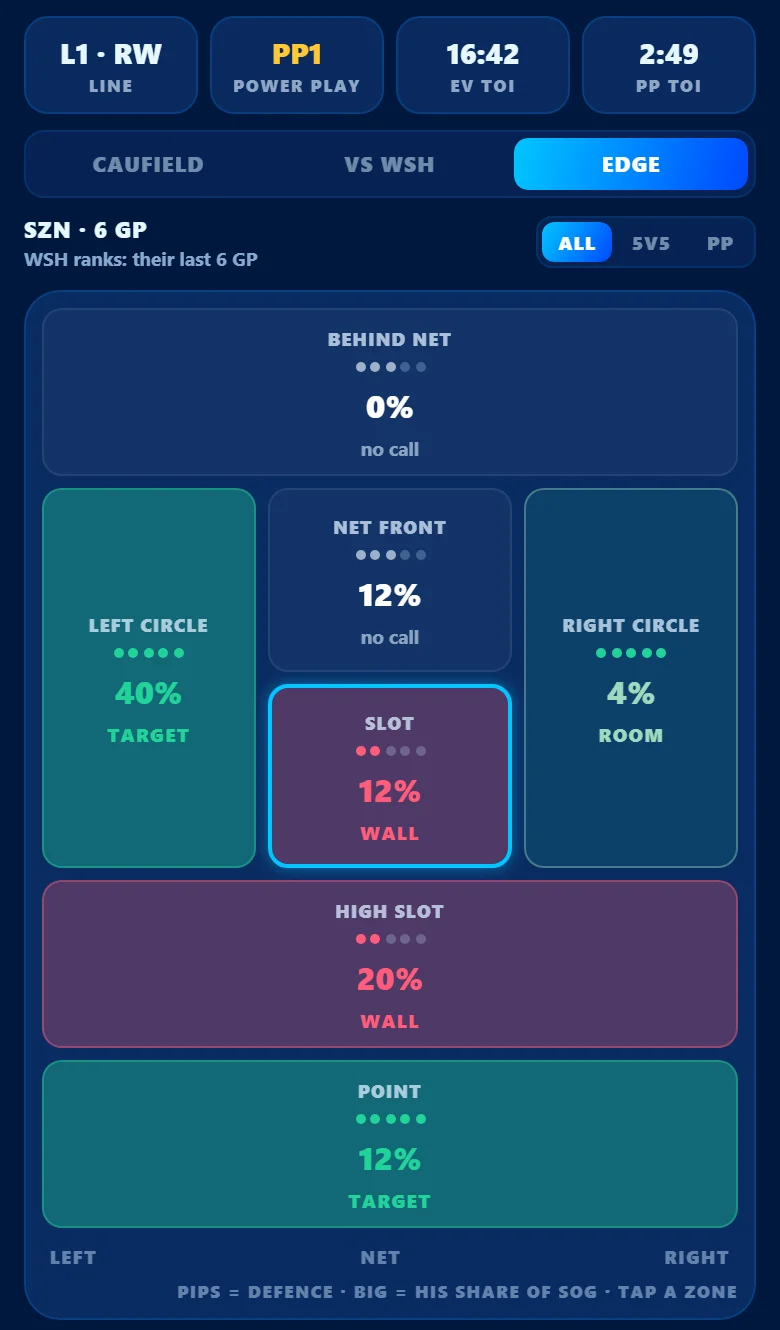
Over 4.5 ShotsNHL · high-danger usage
L25 avg 5.1 · pace up
Field zone +20
Signal weighted MAX
57% · +0.6u
Your tracked record
One engine, every slate: 🏈 NFL 🏀 NBA ⚾ MLB 🏒 NHL 🎓 CFB
Premium · SCEND

Build your own prop-scoring model.

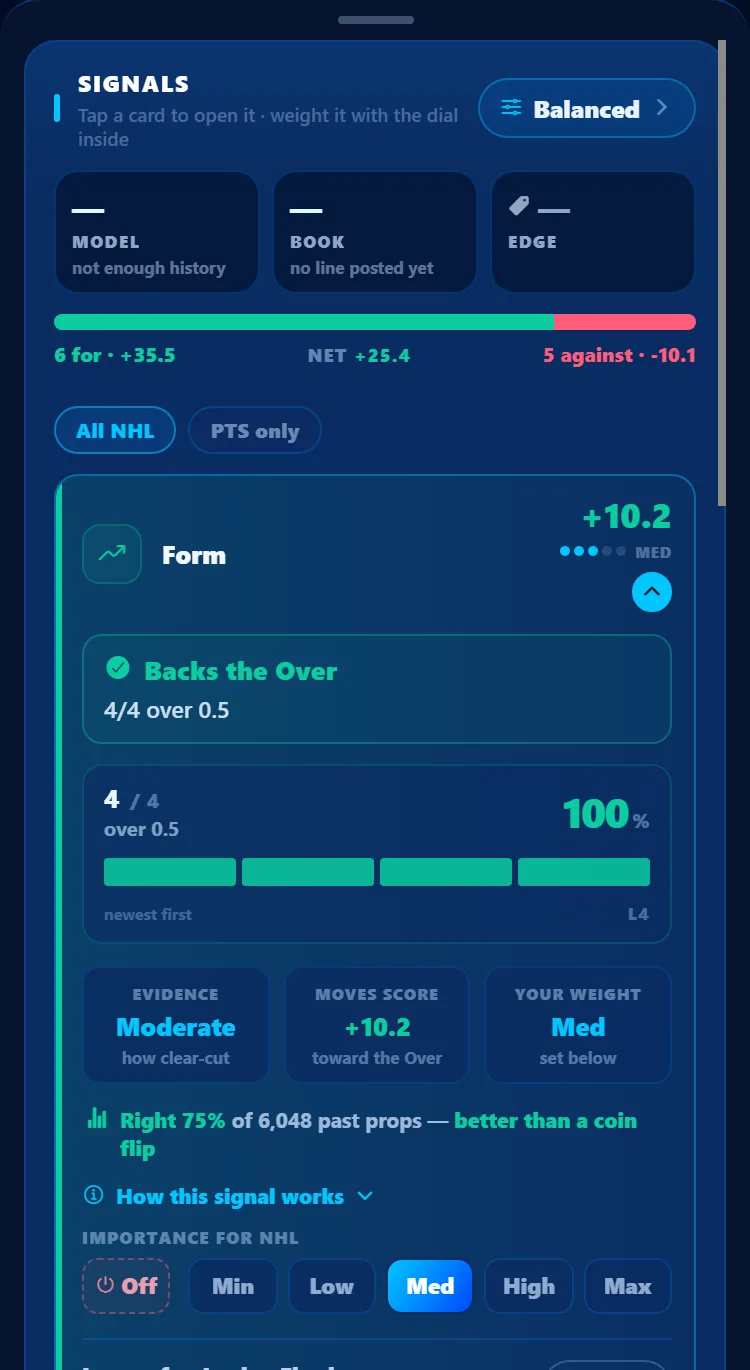
SCEND is the differentiator: a model builder where you decide what matters. Weight 15+ real signals from Off → Max and watch every one's contribution to the score in real time. No black box — you can see exactly why a prop scores the way it does.

  • 15+ weighted signals — Form, Trend, Matchup/DvP, Field Zone, Team Defense, Pace, H2H, Venue, Rest, Usage, Health, Blowout risk, Game script, Pass rush, and more.
  • Auto-Tune + calibration — every signal is backtested for how often it actually predicts; Auto-Tune fits your weights to that hit-rate, per league.
  • My Model's Top Plays — your model reads the whole slate and ranks the strongest leans; every card is scored live.
Matchup HunterHot HandVolume & RoleSharp ModelSituational Edge
Editing a custom model named Receiving RBs — each signal weighted Off, Low, Med, High or Max, with its measured hit-rate and sample size

Editing a custom model in the app. The percentage on each signal is how often it has actually predicted, with its sample size.

The Premium loop

Build → Track → Measure → Refine

Models and the Tracker are one integrated loop. Build a model, track the picks it likes, see exactly how it performs on your settled bets, then tune the weights — so you keep the models that actually win.

1

Build a model that argues your way

Weight 15+ real signals from Off to Max — or start from a preset and change what you disagree with. The score recomputes as you drag, and every signal shows the points it contributed.

Matchup HunterHot HandVolume & RoleSharp Model
SCEND SIGNALSMatchup Hunter ▾
Illustrative · every contribution is visible
Field zone27th of 32 vs his short zone
+20
MAX
🛡
Team defenseAllow the 12th-fewest pass yds
−5.8
HIGH
Form4 / 10 over the line
−2.5
LOW
91
Live score · your modelRecomputes as you weight each signal
Free · Research toolkit

Research every prop by hand — free.

Everything you need to do the homework yourself, no account required. The full board, every split, and deep league-specific intel across all five leagues.

PlayerLab board

Every player and stat, sortable, with matchup ranks — the team-offense "TEAM OFF" spectrum against opponent "OPP DEF" defense-vs-position — and last-10 mini-bar trend charts on every card.

Sort by matchupOPP DEF ranksL10 trend bars

Splits everywhere

L3 / L5 / L10 / L15 / L25 / Season / Head-to-head on every stat, every player.

MLB deep intel

Pitcher matchups, pitch arsenal (usage-weighted xwOBA), batter power (Statcast), batter-vs-pitcher, park & weather, injuries & lineups.

NFL advanced usage

Snap %, air yards, red-zone & end-zone targets, and game-script context — the usage that drives props.

Real screens

One engine, five leagues.

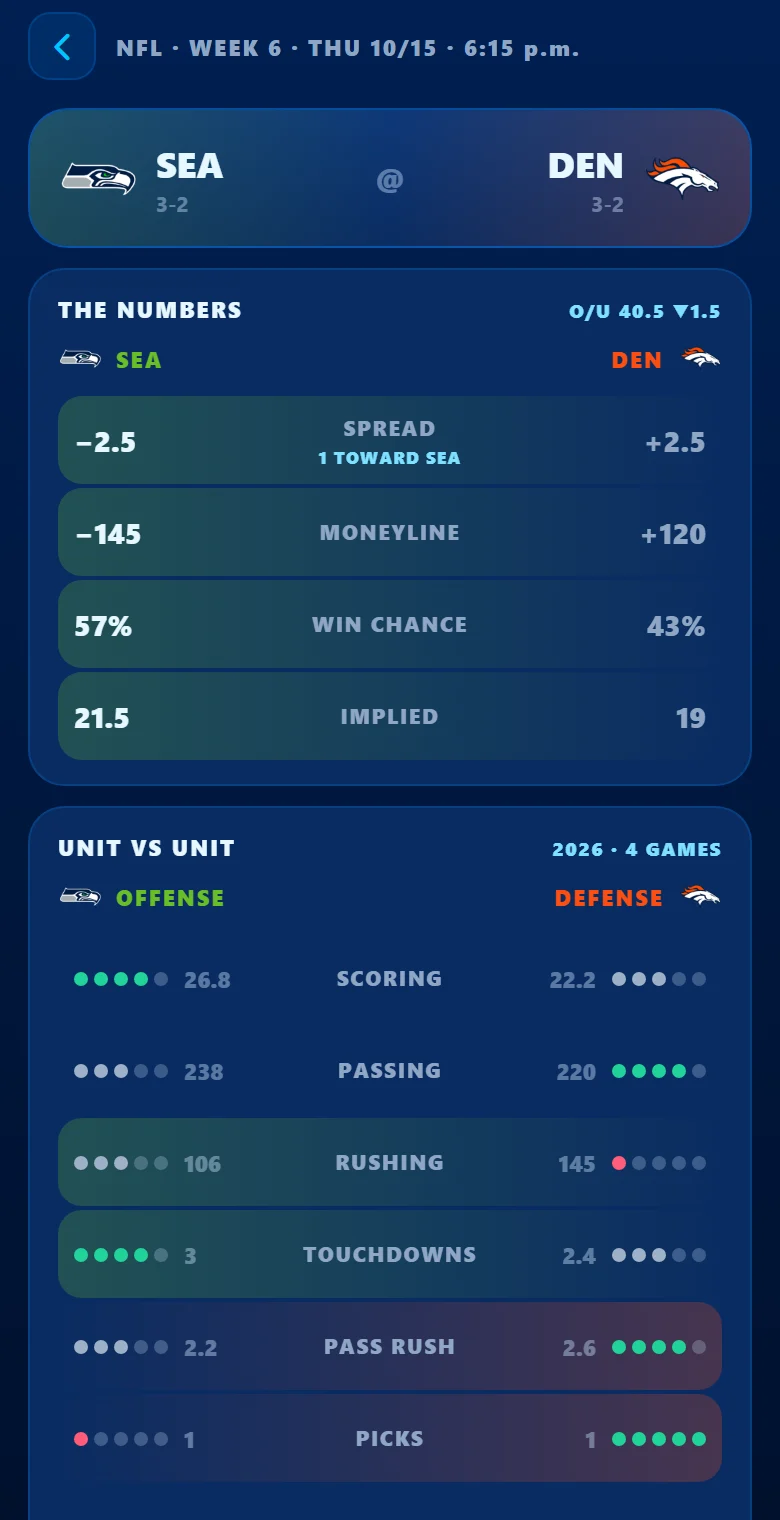
The same research workflow everywhere — and league-specific intel where the sport demands it. Pick a league.

NFL rush map — yards per carry by offensive-line gap, with opponent defensive ranks and gain distribution
A tracked NFL touchdown prop — signal strength with each supporting factor scored

The deepest league in the app

Everything the props actually turn on — where he is used, how the defence gives it up, and who is ahead of him on the chart.

  • Field maps — target, rush and throw maps where colour reads distance from a positional league baseline, not a fixed cutoff. League catch rate runs 81.9% behind the line down to 37.4% deep; one threshold would paint his best zone as a warning.
  • Red-zone signals — red-zone targets and red-zone carries kept separate, so a receiving touchdown and a rushing touchdown are argued from different evidence.
  • Depth charts — with the inheritance link: who he is behind, and what he inherits if that man sits.
  • Advanced usage — snap share, air yards and game-script context alongside the classic splits.
The detail work

The parts most tools skip.

A number without context is a table, not a read. These are the screens built to answer the question you actually had.

Game-log verdict — "was that good?"

Tap a bar in the game log and the screen answers the question that made you tap it: the line, whether it cleared and by how much, where that game sits in his season, a written read of what actually happened, and who else was competing for the ball. The full box score stays underneath, folded away.

73 rushing yards means nothing on its own. 73 against a line of 63.5, in his 8th-best game of the season, 18% above his own average — that is a read.

Game-log verdict — 73 rushing yards against a line of 63.5, cleared by 9.5, with season context and a written explanation of what happened

Teammate correlation

Who heats up — and who cools off — when he goes over his line. Built for parlays, showing actual values rather than bare percentages, with the sample size graded so a three-game fluke does not read like a law.

Teammate correlation — splitting a player's games into over and under his line, showing two teammates heat up and four fade

Injuries & availability

A health timeline rather than a status tag: how much of the season he has actually been available, every absence logged — and what his teammates do when he is out.

Health timeline — season availability game by game, an absence log, and a breakdown of what teammates do when he is out

Full box scores, with efficiency

Volume never travels alone: completion rate, yards per attempt, passer rating, catch rate and yards per target sit beside the totals — derived from what is already there.

Full box score — passing, rushing and receiving with completion rate, yards per attempt, passer rating, catch rate and yards per target

NFL field maps — colour that means something

Target, rush and throw maps where a zone's colour encodes distance from a positional league baseline, not a fixed cutoff — and each player is ranked against the players he is genuinely compared with: same position, volume-gated, regular season only.

Look at "Behind LOS" on the right: a 71% catch rate reads like a strength until you see the league average behind the line is 83.2% — so it scores −12, not green. One fixed threshold would have called it good. Every zone is measured against what that zone is actually worth, and the raw number stays on screen unchanged: the number is the fact, the colour is the judgement.

See the rush map →

NFL target map — share of targets by field zone, with each zone's catch rate scored against the league average for that zone and the opponent's defensive rank
Plans

Research free. Upgrade for the edge.

Everything you need to research by hand is free. Premium adds the SCEND suite — custom models and the Tracker — the personalized, AI-assisted layer.

Free

The research toolkit — no account needed

Always free
  • PlayerLab boardEvery player and stat, sortable, across all five leagues.
  • All splitsL3 / L5 / L10 / L15 / L25 / Season / head-to-head, on every stat.
  • Matchup ranksTeam-offense vs. opponent-defense funnel, ranked league-wide.
  • NFL field maps & red-zone signalsTarget, rush and throw maps scored against positional baselines.
  • Depth charts, injuries & lineupsWho is ahead of him, and who is actually playing.
  • Full box scores & game-log verdictsEfficiency alongside volume, and a read on whether the game was any good.
  • Deep league intelMLB pitcher matchups, park & weather; NFL advanced usage; team stats everywhere.
Get early access →

Free to research during the beta.

Why Ascend

A toolset, not a tout.

We don't sell picks or promise winners. ASCEND gives you the same transparent data and models sharp bettors build for themselves — so every call is yours, and you can see the work behind it.

5

Leagues covered — NFL, NBA, MLB, NHL & college football, one engine.

Transparent

Every signal's contribution is visible. No black boxes, no "locks."

Yours

Build your own models, track your own record, keep what wins.

Get early access to ASCEND

Research free during the beta and lock in early-access pricing on Premium. We're onboarding in waves — drop your email and we'll send your invite.

No spam. Just your invite, launch updates, and Premium pricing when it's set.

FAQ

Good questions

What is a SCEND custom model? +

It's a transparent prop-scoring model you build yourself. You weight 15+ real signals — Form, Matchup/DvP, Field Zone, Team Defense, Pace, H2H, Rest, Usage, Game script and more — from Off to Max, and the model scores every prop accordingly. Nothing is hidden: you can see exactly how much each signal contributes.

What's free vs. Premium? +

The full research toolkit is free — the PlayerLab board, every split, matchup ranks, and deep league intel across the NFL, NBA, MLB, NHL and college football. Premium is the SCEND suite: custom models, Auto-Tune, My Model's Top Plays, and the Tracker (auto-graded W/L, ROI and a model leaderboard on your picks), with cross-device sync.

What does Premium cost? +

Pricing is announced at launch. Join the early-access list and you'll lock in preferred pricing and be first in line when Premium goes live.

Which sports does ASCEND cover? +

Five: the NFL, NBA, MLB, NHL and NCAA football. One engine across all of them, with league-specific intel — NFL field maps, red-zone usage and depth charts; MLB pitcher matchups, park & weather; and multi-season college player history.

Is ASCEND a sportsbook or a pick-seller? +

Neither. ASCEND is a research and analytics tool. We don't take bets, handle money, or sell picks — we give you transparent data and models to do your own research. Always play responsibly and within your means.

How do I get in? +

We're onboarding in waves during the private beta. Drop your email above and we'll send your invite as spots open.

Free to research · 21+ Get early access →